Introducing Connector Private Networking: Join The Upcoming Webinar!
The Importance of Distributed Tracing for Apache Kafka Based Applications
Get started with Confluent, for free
Watch demo: Kafka streaming in 10 minutes
Apache Kafka® based applications stand out for their ability to decouple producers and consumers using an event log as an intermediate layer.
One result of this is that producers and consumers don’t know about each other, as there is no direct communication between them.
This enables choreographed service collaborations, where many components can subscribe to events stored in the event log and react to them asynchronously.
Making sense of the communication and dataflow patterns inside these choreographies, however, can be a challenge. Unlike orchestration communication—which is based on remote procedure calls (RPCs), involves services communicating directly with each other and has explicit dependencies—choreographies contain implicit dependencies and rely on how the components handle and emit events.
Moreover, these distributed components can be implemented in different programming languages, deployed on different platforms and managed by different teams.
At SYSCO AS, a Norwegian consulting firm, we have faced these challenges while helping our customers adopt event-driven architectures. Distributed tracing has been key for helping us create a clear understanding of how applications are related to each other. Most importantly, it has helped us analyze latency issues and debug applications at runtime.
This article describes how to instrument Kafka-based applications with distributed tracing capabilities in order to make dataflows between event-based components more visible. We will cover Kafka clients, Kafka Streams applications, Kafka Connect pipelines and KSQL.
Distributed tracing with Zipkin
Distributed tracing is a method for recording, collecting and recreating execution traces from distributed components. These traces are represented as a set of recorded steps, where every step is known as a span.
Each span contains information about the service and operations being traced, the latency (i.e., how long it takes to execute an operation) and additional metadata like annotations and tags.
Let’s imagine a “Hello, World!” web service that has a greeting operation. This service has a dependency on another service called translation, which emits a response according to the geographical location of the request.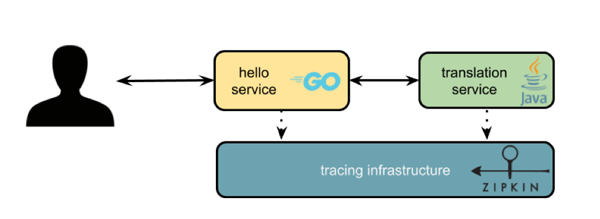
A trace would look like this:
[-----------------hello_world:greeting-----------------------] [-----hello_world:call_translation_service----] [--translation:translate----]
A root span is created when the “Hello, World!” service receives a call to perform the greeting operation. Then another span is created to record how long it takes to call the translation service. The translation service, on the other hand, receives a call to the translate operation and records tracing data.
For the translation service to correlate its spans with the caller service traces, it receives tracing metadata via context propagation (i.e., reading metadata injected into HTTP headers).
A distributed tracing system is designed to collect, process and store tracing data to be queried and visualized later.
In order to generate tracing data, applications can explicitly declare where to create spans and measure latency by annotating code with a tracer utility.
As this is not a trivial task in most codebases where tracing is an afterthought, tracing libraries offer instrumentation in order to collect most of the interactions between components (e.g., RPC calls, database queries), which makes enabling tracing much easier.
Up next, our focus will be on how to instrument Kafka-based applications using Zipkin as our distributed tracing infrastructure.
Zipkin: Distributed tracing infrastructure
Zipkin is one of the most popular distributed tracing projects available. It was open sourced by Twitter in 2012, and now it is in the process of becoming an Apache Software Foundation project.
Zipkin’s architecture consists of a client side, with applications reporting tracing data (lavender), and a server side, where traces are collected, aggregated, stored and made available for querying (green). The transport and database components are pluggable.
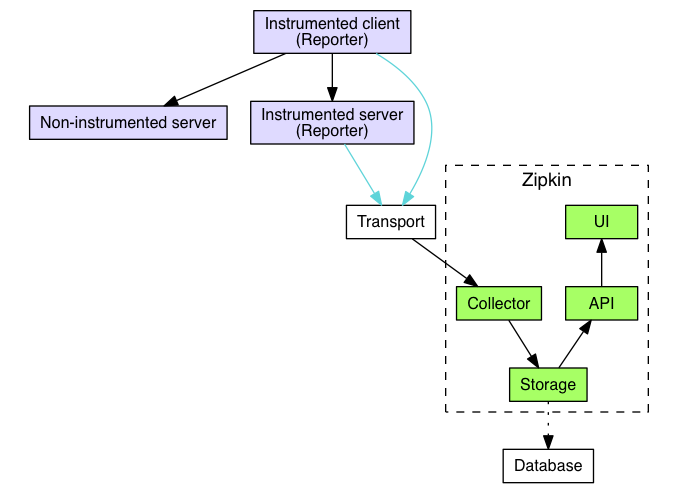
Figure 1. Zipkin Architecture Overview
The transport component is used to ingest tracing data. Transport protocol options include an HTTP API, a Kafka producer and others. Both Apache Cassandra™ and Elasticsearch can be used as data stores for the trace data.
Zipkin provides a Java tracer library called OpenZipkin Brave, which includes built-in instrumentation for applications that use the Kafka consumer, producer or Streams APIs. A list of tracers and instrumentations is available here.
There is a GUI for Zipkin, called Zipkin Lens, which will be shown later in this post.
An example of tracing for Kafka-based applications
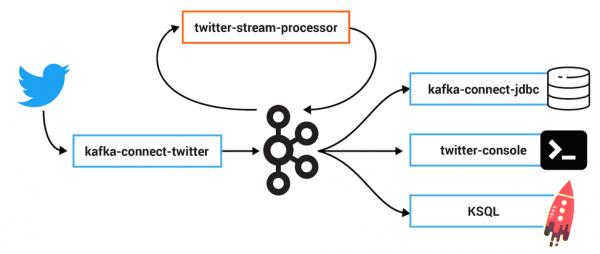
Let’s use an example of a set of distributed applications designed to collect and process tweets published in real time.
Initially, there will be a Kafka source connector for Twitter, collecting and producing messages from Twitter posts in real time. A stream processing application will parse the JSON messages, and filter and produce Avro-formatted records. On the other side, several consumers will subscribe to these events: A Kafka sink connector for JDBC will send tweets downstream to a Postgres database, and a KSQL application will process records further.
Kafka interceptors for Zipkin
The interceptor API is part of the Kafka clients library, allowing users to inject code around sending and receiving operations.
At SYSCO AS, we have developed Kafka interceptors for Zipkin, which create traces from every message produced and consumed by any application using the producer and consumer APIs.
Tracing Kafka connectors
Kafka Connect is part of Apache Kafka and enables you to integrate Kafka with other systems using configuration files to define the integration. Numerous connectors are available from Confluent Hub, and there is an API for building your own if you can’t find what you need.
Because Kafka Connect plugins are already packaged components, it’s not obvious at first glance how to implement tracing on them. This is where interceptors can be used to inject tracing capabilities. Let’s see how it works.
By adding the Zipkin interceptor JAR file to the connector’s classpath and defining interceptor classes, we can collect traces from Kafka connectors. In this case, they come from the Kafka Connect Twitter Source Connector and the Kafka Connect JDBC Sink Connector:

Above, we can see a trace created for each message produced to Kafka. The interceptor on the Kafka Connect source injects tracing metadata into Kafka headers. This information is propagated to the consumers, where the interceptor on the Kafka Connect sink can correlate traces on its side with the traces created on the source. This means you can have a complete view of every message produced and consumed already correlated and presented as a trace. This information can be used for debugging and latency analysis.
Introducing tracing inevitably results in a performance impact, with applications carrying out additional operations, such as measuring latency, collecting traces and reporting to tracing infrastructure. In some scenarios where services are latency sensitive, recording and reporting every trace are not affordable. In such cases, sampling strategies (e.g., rate limit sampling: collecting a percentage of executions per second) can be applied to reduce performance impact.
Zipkin instrumentation for Kafka Streams and clients
Continuing with our use case, in between Kafka connectors there is a Kafka Streams application that transforms JSON messages into Avro binary records.
When you run the Kafka Streams application, the process will look like this:
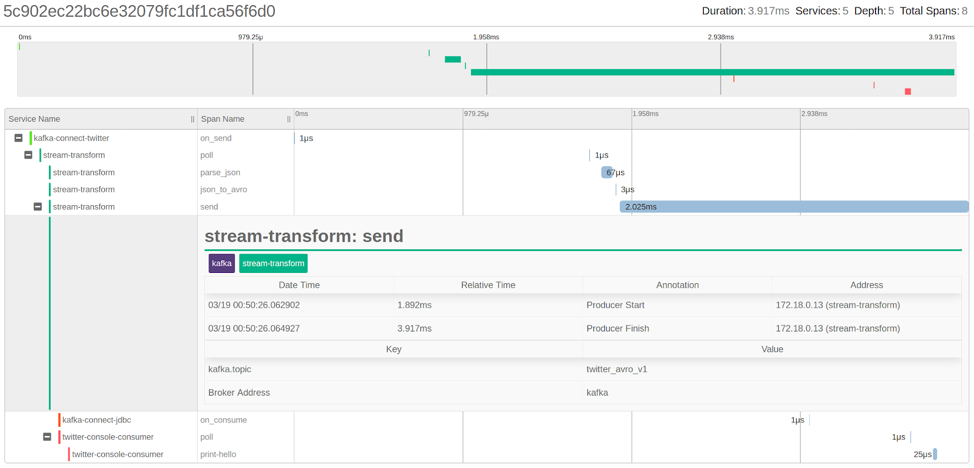
We observe that four spans have been correlated with the initial span created by the Kafka Connect source described above. These spans have been created by the Kafka Streams application, where the first span (poll) represents the messages consumed, and the next two (parse_json and json_to_avro) represent processing and transformation from JSON to Avro. The last one (send) represents the record being sent to another Kafka topic. Overall, this transaction is taking ~4 ms.
It is important to note the gaps between spans that represent latency between event-driven components participating in a transaction.
For further details, you can explore Kafka consumer and producer instrumentation.
Tracing for KSQL
Similar to Kafka Connect, KSQL is also a packaged component based on standard Kafka APIs that enables the usage of Kafka interceptors. This can be a useful technique in addition to the concepts in this previous blog discussing how to gather metrics and monitor KSQL.
In KSQL, we’ll create a STREAM from the tweets topic:
bash
$ ksql http://localhost:8088
ksql> CREATE STREAM twitter_avro_v1 WITH (KAFKA_TOPIC='twitter_avro_v1', VALUE_FORMAT='AVRO');
ksql> SELECT username FROM twitter_avro_v1;
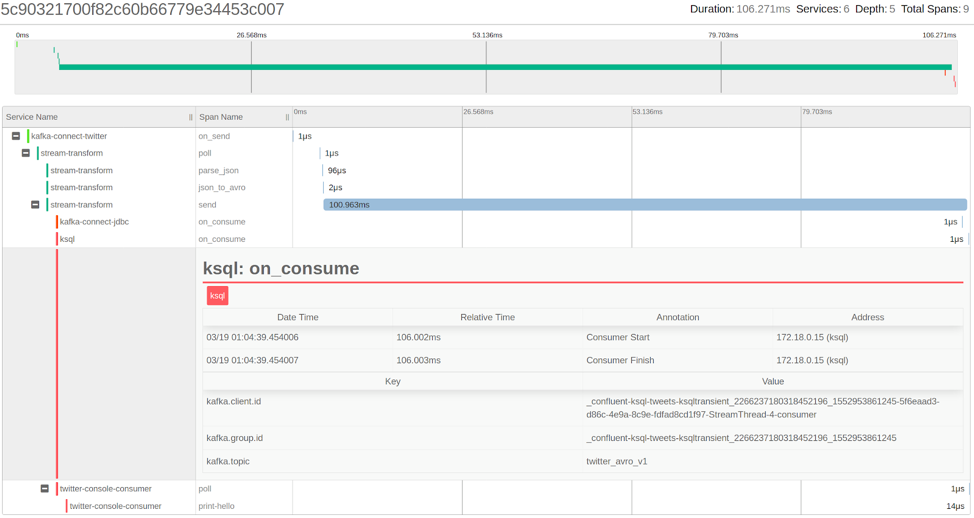
A span created by KSQL consumption of a message is added to the trace, along with metadata about the client as well as the topic being consumed. The complete trace—from the Twitter connector to the KSQL applications and all other consumers—is taking 108 ms to execute.
Tracing is just the first step
Tracing is by no means the only way to increase understanding of distributed systems—logging and metrics are just as useful. At the end of the day, what matters is that you have enough information available to troubleshoot production problems as efficiently as possible.
Beyond this, the data recorded from live execution of your applications using platforms like Zipkin can become the foundation for building models that enrich your understanding and operational capabilities.
Examples of companies doing this include:
- The research and implementation guided by Peter Alvaro et al. at Netflix, who used tracing data to identify execution paths and increase the efficiency of chaos engineering tools.
Also at Netflix, tracing data is the foundation for developing tools like Vizceral. - Facebook has recognized the challenges of managing tracing data and its heterogeneous nature. They build models on top of raw tracing data to feed different personas of their organization on their Canopy paper.
- Expedia’s Haystack platform is an example of an open source platform that uses tracing data as the main source for trend analysis and anomaly detection.
In Zipkin, we have a service dependency model created from tracing data that, in following our scenario, looks like this:
This graph is based on the Netflix Vizceral model and represents service dependencies. Here, we can see which services are producing and consuming data from Kafka.
By tracing your distributed Kafka-based applications—and in general any distributed system—we gain an additional source of data representing how components collaborate per request; we can observe what a dataflow looks like. The data provides evidence to determine what is causing errors and more effectively identify the reasons for latencies in our pipelines. We are collecting data to answer questions we did not know we would have.
If you’re interested in the details on how to run the demonstrations shown in this article, you can visit GitHub.
To see what KSQL can do, download the Confluent Platform and get started with the streaming SQL engine for Apache Kafka.
Get started with Confluent, for free
Watch demo: Kafka streaming in 10 minutes
Ist dieser Blog-Beitrag interessant? Jetzt teilen
Confluent-Blog abonnieren


Introducing Versioned State Store in Kafka Streams
Versioned key-value state stores, introduced to Kafka Streams in 3.5, enhance stateful processing capabilities by allowing users to store multiple record versions per key, rather than only the single latest version per key as is the case for existing key-value stores today...


Delivery Guarantees and the Ethics of Teleportation
This blog post discusses the two generals problems, how it impacts message delivery guarantees, and how those guarantees would affect a futuristic technology such as teleportation.