Introducing Connector Private Networking: Join The Upcoming Webinar!
Kafka Connect Deep Dive – Error Handling and Dead Letter Queues
Get started with Confluent, for free
Watch demo: Kafka streaming in 10 minutes
Kafka Connect is part of Apache Kafka® and is a powerful framework for building streaming pipelines between Kafka and other technologies. It can be used for streaming data into Kafka from numerous places including databases, message queues and flat files, as well as streaming data from Kafka out to targets such as document stores, NoSQL, databases, object storage and so on.
In a perfect world, nothing would go wrong, but when it does we want our pipelines to handle it as gracefully as possible. A common example of this would be getting a message on a topic that doesn’t match the specific serialization (JSON when Avro is expected, and vice versa). Since Apache Kafka 2.0, Kafka Connect has included error handling options, including the functionality to route messages to a dead letter queue, a common technique in building data pipelines.
Here, we’ll look at several common patterns for handling problems and examine how they can be implemented.
“Fail fast”
Sometimes you may want to stop processing as soon as an error occurs. Perhaps encountering bad data is a symptom of problems upstream that must be resolved, and there’s no point in continuing to try processing other messages.
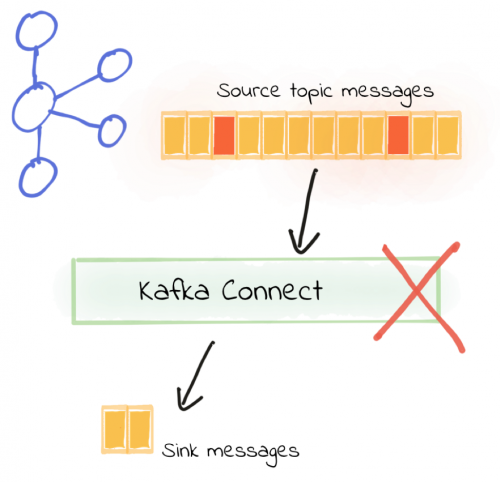
This is the default behavior of Kafka Connect, and it can be set explicitly with the following:
errors.tolerance = none
In this example, the connector is configured to read JSON data from a topic, writing it to a flat file. An important note here is that I’m using the FileStream connector for demonstration purposes, but it is not recommended for use in production.
curl -X POST http://localhost:8083/connectors -H "Content-Type: application/json" -d '{
        "name": "file_sink_01",
        "config": {
                "connector.class": "org.apache.kafka.connect.file.FileStreamSinkConnector",
                "topics":"test_topic_json",
                "value.converter":"org.apache.kafka.connect.json.JsonConverter",
                "value.converter.schemas.enable": false,
                "key.converter":"org.apache.kafka.connect.json.JsonConverter",
                "key.converter.schemas.enable": false,
                "file":"/data/file_sink_01.txt"
                }
        }'
Some of the JSON messages in the topic are invalid, and the connector aborts immediately, going into the FAILED state:
$ curl -s "http://localhost:8083/connectors/file_sink_01/status"| \
    jq -c -M '[.name,.tasks[].state]'
["file_sink_01","FAILED"]
Looking at the Kafka Connect worker log we can see that the error is logged and the task aborts:
org.apache.kafka.connect.errors.ConnectException: Tolerance exceeded in error handler
 at org.apache.kafka.connect.runtime.errors.RetryWithToleranceOperator.execAndHandleError(RetryWithToleranceOperator.java:178)
…
Caused by: org.apache.kafka.connect.errors.DataException: Converting byte[] to Kafka Connect data failed due to serialization error:
 at org.apache.kafka.connect.json.JsonConverter.toConnectData(JsonConverter.java:334)
…
Caused by: org.apache.kafka.common.errors.SerializationException: com.fasterxml.jackson.core.JsonParseException: Unexpected character ('b' (code 98)): was expecting double-quote to start field name
 at [Source: (byte[])"{brokenjson-:"bar 1"}"; line: 1, column: 3]
To fix the pipeline, we need to resolve the issue with the message on the source topic. Kafka Connect will not simply “skip” the bad message unless we tell it to. If it’s a configuration error (for example, we specified the wrong serialization converter), that’s fine since we can correct it and then restart the connector. However, if it is indeed a bad record on the topic, we need to find a way to not block the processing of all of the other records that are valid.
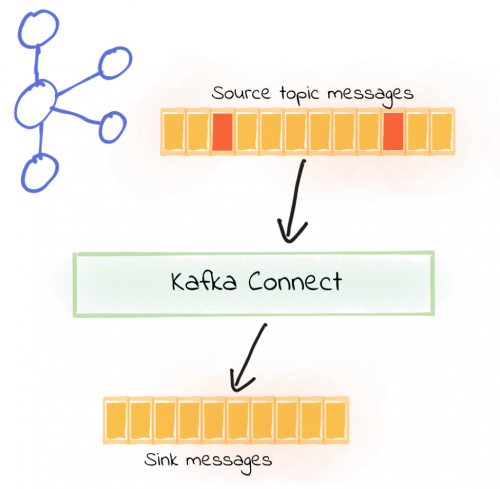
YOLO: Silently ignore bad messages
I just want the darned thing to work!
errors.tolerance = all
In action this looks like:
curl -X POST http://localhost:8083/connectors -H "Content-Type: application/json" -d '{
        "name": "file_sink_05",
        "config": {
                "connector.class": "org.apache.kafka.connect.file.FileStreamSinkConnector",
                "topics":"test_topic_json",
                "value.converter":"org.apache.kafka.connect.json.JsonConverter",
                "value.converter.schemas.enable": false,
                "key.converter":"org.apache.kafka.connect.json.JsonConverter",
                "key.converter.schemas.enable": false,
                "file":"/data/file_sink_05.txt",
                "errors.tolerance": "all"
                }
        }'
Now when we launch the connector (against the same source topic as before, in which there is a mix of valid and invalid messages), it runs just fine:
$ curl -s "http://localhost:8083/connectors/file_sink_05/status"| \
    jq -c -M '[.name,.tasks[].state]'
["file_sink_05","RUNNING"]
There are no errors written to the Kafka Connect worker output, even with invalid messages on the source topic being read by the connector. Data from the valid messages is written to the output file, as expected:
$ head data/file_sink_05.txt
{foo=bar 1}
{foo=bar 2}
{foo=bar 3}
…
If a message falls in the woods, does it make a noise?
We’ve seen how setting errors.tolerance = all will enable Kafka Connect to just ignore bad messages. When it does, by default it won’t log the fact that messages are being dropped. If you do set errors.tolerance = all, make sure you’ve carefully thought through if and how you want to know about message failures that do occur. In practice that means monitoring/alerting based on available metrics, and/or logging the message failures.
The most simplistic approach to determining if messages are being dropped is to tally the number of messages on the source topic with those written to the output:
$ kafkacat -b localhost:9092 -t test_topic_json -o beginning -C -e -q -X enable.partition.eof=true | wc -l
150

$ wc -l data/file_sink_05.txt
100 data/file_sink_05.txt
This is hardly elegant but it does show that we’re dropping messages—and since there’s no mention in the log of it we’d be none the wiser.
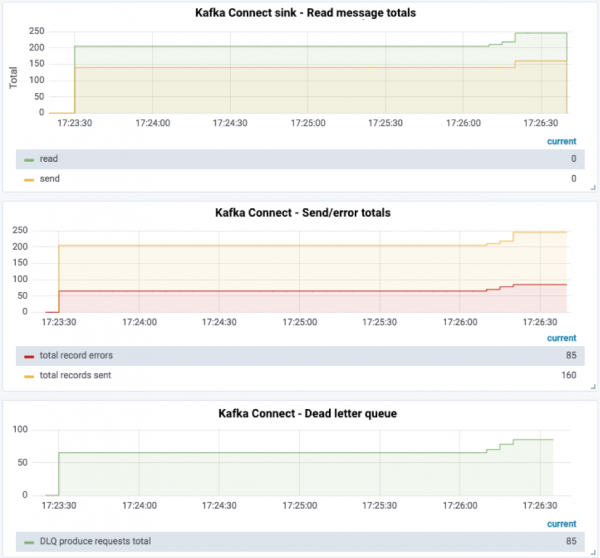
A much more solid route to take would be using JMX metrics and actively monitoring and alerting on error message rates:

We can see that there are errors occurring, but we have no idea what and on which messages. Now that may be what we want (head in the sand, who cares if we drop messages), but in reality we should know about any message being dropped, even if it is to then consciously and deliberately send it to /dev/null at a later point. This is where the concept of a dead letter queue comes in.
Route messages to a dead letter queue
Kafka Connect can be configured to send messages that it cannot process (such as a deserialization error as seen in “fail fast” above) to a dead letter queue, which is a separate Kafka topic. Valid messages are processed as normal, and the pipeline keeps on running. Invalid messages can then be inspected from the dead letter queue, and ignored or fixed and reprocessed as required.
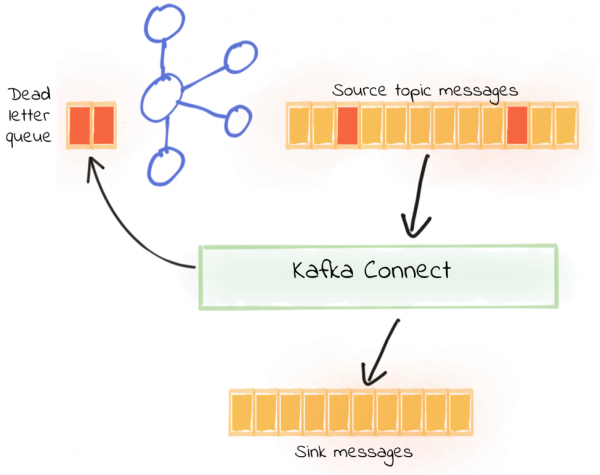
To use the dead letter queue, you need to set:
errors.tolerance = all
errors.deadletterqueue.topic.name =
If you’re running on a single-node Kafka cluster, you will also need to set errors.deadletterqueue.topic.replication.factor = 1—by default it’s three.
An example connector with this configuration looks like this:
curl -X POST http://localhost:8083/connectors -H "Content-Type: application/json" -d '{
        "name": "file_sink_02",
        "config": {
                "connector.class": "org.apache.kafka.connect.file.FileStreamSinkConnector",
                "topics":"test_topic_json",
                "value.converter":"org.apache.kafka.connect.json.JsonConverter",
                "value.converter.schemas.enable": false,
                "key.converter":"org.apache.kafka.connect.json.JsonConverter",
                "key.converter.schemas.enable": false,
                "file": "/data/file_sink_02.txt",
                "errors.tolerance": "all",
                "errors.deadletterqueue.topic.name":"dlq_file_sink_02",
                "errors.deadletterqueue.topic.replication.factor": 1
                }
        }'
Using the same source topic as before—with a mix of good and bad JSON records—the new connector runs successfully:
$ curl -s "http://localhost:8083/connectors/file_sink_02/status"| \
    jq -c -M '[.name,.tasks[].state]'
["file_sink_02","RUNNING"]
Valid records from the source topic get written to the target file:
$ head data/file_sink_02.txt
{foo=bar 1}
{foo=bar 2}
{foo=bar 3}
[…]
So our pipeline is intact and continues to run, and now we also have data in the dead letter queue topic. This can be seen from the metrics:
It can also be seen from inspecting the topic itself:
ksql> LIST TOPICS;
 Kafka Topic            | Registered | Partitions | Partition Replicas | Consumers | ConsumerGroups
---------------------------------------------------------------------------------------------------
 dlq_file_sink_02       | false      | 1          | 1                  | 0         | 0
 test_topic_json        | false      | 1          | 1                  | 1         | 1
---------------------------------------------------------------------------------------------------
ksql> PRINT 'dlq_file_sink_02' FROM BEGINNING;
Format:STRING
1/24/19 5:16:03 PM UTC , NULL , {foo:"bar 1"}
1/24/19 5:16:03 PM UTC , NULL , {foo:"bar 2"}
1/24/19 5:16:03 PM UTC , NULL , {foo:"bar 3"}
…
In the output, the message timestamp (1/24/19 5:16:03 PM UTC) and key (NULL) are shown, and then the value. As you can see, the value is not valid JSON {foo:"bar 1"} (the foo should be in quotation marks too), and thus the JsonConverter threw an exception when processing it, hence it ended up on the dead letter topic.
But, it’s only by eyeballing the messages that we can see that it’s not valid JSON, and even then we can only hypothesize as to why the message got rejected. To determine the actual reason why a message is treated as invalid by Kafka Connect there are two options:
- Dead letter queue message headers
- Kafka Connect worker log
Let’s look at these in turn.
Recording the failure reason for a message: Message headers
Headers are additional metadata stored with the Kafka message’s key, value and timestamp, and were introduced in Kafka 0.11 (see KIP-82). Kafka Connect can write information about the reason for a message’s rejection into the header of the message itself. In my opinion this option is the better one than just writing to the log file because it ties the reason directly to the message.
To include the reason for rejection in the header of the dead letter queue message, simply set:
errors.deadletterqueue.context.headers.enable = true
This gives us a configuration that looks like this:
curl -X POST http://localhost:8083/connectors -H "Content-Type: application/json" -d '{
        "name": "file_sink_03",
        "config": {
                "connector.class": "org.apache.kafka.connect.file.FileStreamSinkConnector",
                "topics":"test_topic_json",
                "value.converter":"org.apache.kafka.connect.json.JsonConverter",
                "value.converter.schemas.enable": false,
                "key.converter":"org.apache.kafka.connect.json.JsonConverter",
                "key.converter.schemas.enable": false,
                "file": "/data/file_sink_03.txt",
                "errors.tolerance": "all",
                "errors.deadletterqueue.topic.name":"dlq_file_sink_03",
                "errors.deadletterqueue.topic.replication.factor": 1,
                "errors.deadletterqueue.context.headers.enable":true
                }
        }'
As before, the connector runs successfully (because we’ve set errors.tolerance=all):
$ curl -s "http://localhost:8083/connectors/file_sink_03/status"| \
    jq -c -M '[.name,.tasks[].state]'
["file_sink_03","RUNNING"]
Valid records from the source topic get written to the target file:
$ head data/file_sink_03.txt
{foo=bar 1}
{foo=bar 2}
{foo=bar 3}
[…]
You can use any consumer tool to examine the messages on the dead letter queue (we used KSQL above for this). Here, I’m going to use kafkacat, and you’ll see why in a moment.
In its simplest operation, it looks like this:
kafkacat -b localhost:9092 -t dlq_file_sink_03
% Auto-selecting Consumer mode (use -P or -C to override)
{foo:"bar 1"}
{foo:"bar 2"}
…
But kafkacat has super powers! Put on your X-ray glasses, and you get to see a whole lot more information than just the message value itself:
kafkacat -b localhost:9092 -t dlq_file_sink_03 -C -o-1 -c1 \
  -f '\nKey (%K bytes): %k
  Value (%S bytes): %s
  Timestamp: %T
  Partition: %p
  Offset: %o
  Headers: %h\n'
This takes the last message (-o-1, i.e., for offset, use the last 1 message), just reads one message (-c1) and formats it as instructed by the -f parameter with all of the goodies available:
Key (-1 bytes):
  Value (13 bytes): {foo:"bar 5"}
  Timestamp: 1548350164096
  Partition: 0
  Offset: 34
  Headers: __connect.errors.topic=test_topic_json,__connect.errors.partition=0,__connect.errors.offset=94,__connect.errors.connector.name=file_sink_03,__connect.errors.task.id=0,__connect.errors.stage=VALU
E_CONVERTER,__connect.errors.class.name=org.apache.kafka.connect.json.JsonConverter,__connect.errors.exception.class.name=org.apache.kafka.connect.errors.DataException,__connect.errors.exception.message=Co
nverting byte[] to Kafka Connect data failed due to serialization error: ,__connect.errors.exception.stacktrace=org.apache.kafka.connect.errors.DataException: Converting byte[] to Kafka Connect data failed
 due to serialization error:
[…]
You can also select just the headers from the message and with some simple shell magic split them up to clearly see all of the information about the problem:
$ kafkacat -b localhost:9092 -t dlq_file_sink_03 -C -o-1 -c1 -f '%h'|tr ',' '\n'
__connect.errors.topic=test_topic_json
__connect.errors.partition=0
__connect.errors.offset=94
__connect.errors.connector.name=file_sink_03
__connect.errors.task.id=0
__connect.errors.stage=VALUE_CONVERTER
__connect.errors.class.name=org.apache.kafka.connect.json.JsonConverter
__connect.errors.exception.class.name=org.apache.kafka.connect.errors.DataException
__connect.errors.exception.message=Converting byte[] to Kafka Connect data failed due to serialization error:
Each message that Kafka Connect processes comes from a source topic and from a particular point (offset) in that topic. The header information shows us precisely that, and we can use it to go back to the original topic and inspect the original message if we want to. Since the dead letter queue has a copy of the message, this check is more of a belts-and-braces thing.
Taking the detail from the headers above, let’s inspect the source message for:
__connect.errors.topic=test_topic_json
__connect.errors.offset=94
Plugging these values into kafkacat’s -t and -o parameters for topic and offset, respectively, gives us:
$ kafkacat -b localhost:9092 -C \
  -t test_topic_json -o94 \
  -f '\nKey (%K bytes): %k
  Value (%S bytes): %s
  Timestamp: %T
  Partition: %p
  Offset: %o
  Topic: %t\n'

Key (-1 bytes):
  Value (13 bytes): {foo:"bar 5"}
  Timestamp: 1548350164096
  Partition: 0
  Offset: 94
  Topic: test_topic_json
Compared to the above message from the dead letter queue, you’ll see it’s exactly the same, even down to the timestamp. The only difference is the topic (obviously), the offset and the headers.
Recording the failure reason for a message: Log
The second option for recording the reason for rejecting a message is to write it to the log. Depending on your installation, Kafka Connect either writes this to stdout, or to a log file. Either way, you get a bunch of verbose output for each failed message. To enable this, set:
errors.log.enable = true
You can also opt to include metadata about the message itself in the output by setting errors.log.include.messages = true. This metadata includes some of the same items you can see added to the message headers above, including the source message’s topic and offset. Note that it doesn’t include the message key or value itself, despite what you may assume given the parameter name.
This gives us a connector that looks like this:
curl -X POST http://localhost:8083/connectors -H "Content-Type: application/json" -d '{
        "name": "file_sink_04",
        "config": {
                "connector.class": "org.apache.kafka.connect.file.FileStreamSinkConnector",
                "topics":"test_topic_json",
                "value.converter":"org.apache.kafka.connect.json.JsonConverter",
                "value.converter.schemas.enable": false,
                "key.converter":"org.apache.kafka.connect.json.JsonConverter",
                "key.converter.schemas.enable": false,
                "file": "/data/file_sink_04.txt",
                "errors.tolerance": "all",
                "errors.log.enable":true,
                "errors.log.include.messages":true
                }
        }'
The connector runs successfully:
$ curl -s "http://localhost:8083/connectors/file_sink_04/status"| \
    jq -c -M '[.name,.tasks[].state]'
["file_sink_04","RUNNING"]
Valid records from the source topic get written to the target file:
$ head data/file_sink_04.txt
{foo=bar 1}
{foo=bar 2}
{foo=bar 3}
[…]
In the Kafka Connect worker log there are errors for each failed record:
ERROR Error encountered in task file_sink_04-0. Executing stage 'VALUE_CONVERTER' with class 'org.apache.kafka.connect.json.JsonConverter', where consumed record is {topic='test_topic_json', partition=0, offset=94, timestamp=1548350164096, timestampType=CreateTime}. (org.apache.kafka.connect.runtime.errors.LogReporter)
org.apache.kafka.connect.errors.DataException: Converting byte[] to Kafka Connect data failed due to serialization error:
 at org.apache.kafka.connect.json.JsonConverter.toConnectData(JsonConverter.java:334)
[…]
Caused by: org.apache.kafka.common.errors.SerializationException: com.fasterxml.jackson.core.JsonParseException: Unexpected character ('f' (code 102)): was expecting double-quote to start field name
 at [Source: (byte[])"{foo:"bar 5"}"; line: 1, column: 3]
So we get the error itself, along with information about the message:
{topic='test_topic_json', partition=0, offset=94, timestamp=1548350164096, timestampType=CreateTime}
As shown above, we could use that topic and offset information in a tool like kafkacat to examine the message at source. Depending on the exception thrown, we may also see it logged:
Caused by: org.apache.kafka.common.errors.SerializationException:
…
at [Source: (byte[])"{foo:"bar 5"}"; line: 1, column: 3]
Processing messages from a dead letter queue
So we’ve set up a dead letter queue, but what do we do with those “dead letters”? Well, since it’s just a Kafka topic, we can use the standard range of Kafka tools just as we would with any other topic. We saw this above using kafkacat to examine the headers, and for general inspection of the guts of a message and its metadata kafkacat is great. It may be that we opt to just replay the messages—it just depends on the reason for which they were rejected.
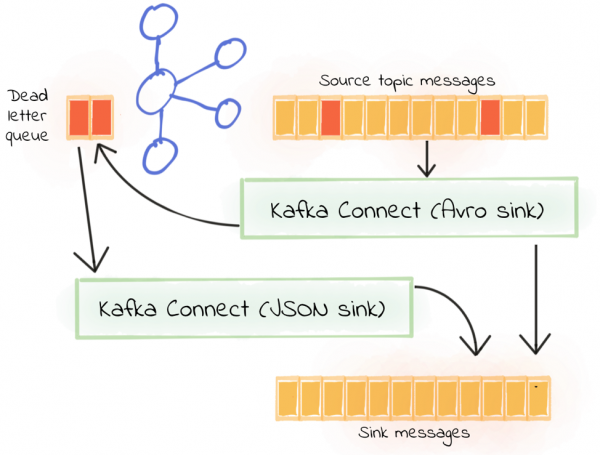
One scenario could be that the connector is using the Avro converter, and JSON messages are encountered on the topic (and thus routed to the dead letter queue)? Perhaps for legacy reasons we have producers of both JSON and Avro writing to our source topic. We know it’s bad; we know we need to fix it—but for now, we just need to get the pipeline flowing with all the data written to the sink.
First, we start with the initial sink reading from the source topic, deserializing using Avro and routing to a dead letter queue:
curl -X POST http://localhost:8083/connectors -H "Content-Type: application/json" -d '{
        "name": "file_sink_06__01-avro",
        "config": {
                "connector.class": "org.apache.kafka.connect.file.FileStreamSinkConnector",
                "topics":"test_topic_avro",
                "file":"/data/file_sink_06.txt",
                "key.converter": "io.confluent.connect.avro.AvroConverter",
                "key.converter.schema.registry.url": "http://schema-registry:8081",
                "value.converter": "io.confluent.connect.avro.AvroConverter",
                "value.converter.schema.registry.url": "http://schema-registry:8081",
                "errors.tolerance":"all",
                "errors.deadletterqueue.topic.name":"dlq_file_sink_06__01",
                "errors.deadletterqueue.topic.replication.factor":1,
                "errors.deadletterqueue.context.headers.enable":true,
                "errors.retry.delay.max.ms": 60000,
                "errors.retry.timeout": 300000
                }
        }'
In addition, we create a second sink, taking the dead letter queue of the first as the source topic and attempting to deserialize the records as JSON. All we do here is change the value.converter and key.converter, the source topic name and the name for the dead letter queue (to avoid recursion if this connector has to route any messages to a dead letter queue).
curl -X POST http://localhost:8083/connectors -H "Content-Type: application/json" -d '{
        "name": "file_sink_06__02-json",
        "config": {
                "connector.class": "org.apache.kafka.connect.file.FileStreamSinkConnector",
                "topics":"dlq_file_sink_06__01",
                "file":"/data/file_sink_06.txt",
                "value.converter":"org.apache.kafka.connect.json.JsonConverter",
                "value.converter.schemas.enable": false,
                "key.converter":"org.apache.kafka.connect.json.JsonConverter",
                "key.converter.schemas.enable": false,
                "errors.tolerance":"all",
                "errors.deadletterqueue.topic.name":"dlq_file_sink_06__02",
                "errors.deadletterqueue.topic.replication.factor":1,
                "errors.deadletterqueue.context.headers.enable":true,
                "errors.retry.delay.max.ms": 60000,
                "errors.retry.timeout": 300000
                }
        }'
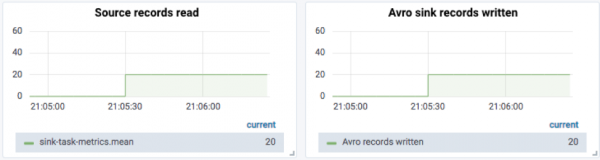
To start with, the source topic gets 20 Avro records, and we can see 20 records read and 20 written out by the original Avro sink:
Then eight JSON records are sent in, eight messages get sent to the dead letter queue and eight are written out by the JSON sink:
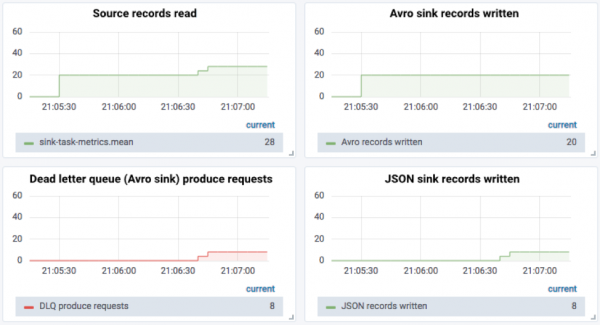
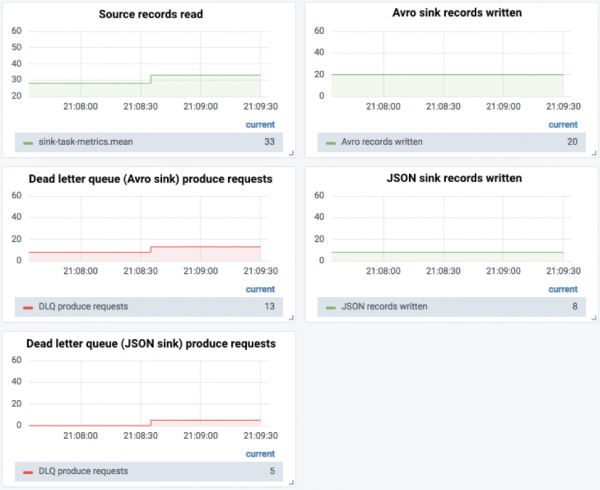
Now we send five malformed JSON records in, and we can see that there are “real” failed messages from both, evidenced by two things:
- The disparity between the number of messages sent to the dead letter queue from the Avro sink and the number of JSON messages successfully sent
- Messages being sent to the dead letter queue for the JSON sink
Monitoring dead letter queue with KSQL
As well as using JMX to monitor the dead letter queue, we can also take advantage of KSQL’s aggregation capabilities and write a simple streaming application to monitor the rate at which messages are written to the queue:
-- Register stream for each dead letter queue topic.
CREATE STREAM dlq_file_sink_06__01 (MSG VARCHAR) WITH (KAFKA_TOPIC='dlq_file_sink_06__01', VALUE_FORMAT='DELIMITED');
CREATE STREAM dlq_file_sink_06__02 (MSG VARCHAR) WITH (KAFKA_TOPIC='dlq_file_sink_06__02', VALUE_FORMAT='DELIMITED');

-- Consume data from the beginning of the topic
SET 'auto.offset.reset' = 'earliest';

-- Create a monitor stream with additional columns
--  that can be used for subsequent aggregation queries
CREATE STREAM DLQ_MONITOR WITH (VALUE_FORMAT='AVRO') AS \
  SELECT 'dlq_file_sink_06__01' AS SINK_NAME, \
         'Records: ' AS GROUP_COL, \
         MSG \
    FROM dlq_file_sink_06__01;

-- Populate the same monitor stream with records from
--  the second dead letter queue
INSERT INTO DLQ_MONITOR \
  SELECT 'dlq_file_sink_06__02' AS SINK_NAME, \
         'Records: ' AS GROUP_COL, \
         MSG \
    FROM dlq_file_sink_06__02;

-- Create an aggregate view of the number of messages
--  in each dead letter queue per minute window
CREATE TABLE DLQ_MESSAGE_COUNT_PER_MIN AS \
  SELECT TIMESTAMPTOSTRING(WINDOWSTART(),'yyyy-MM-dd HH:mm:ss') AS START_TS, \
         SINK_NAME, \
         GROUP_COL, \
         COUNT(*) AS DLQ_MESSAGE_COUNT \
    FROM DLQ_MONITOR \
          WINDOW TUMBLING (SIZE 1 MINUTE) \
 GROUP BY SINK_NAME, \
          GROUP_COL;
This aggregate table can be queried interactively. Below shows how many messages were on each dead letter queue in a one-minute period:
ksql> SELECT START_TS, SINK_NAME, DLQ_MESSAGE_COUNT FROM DLQ_MESSAGE_COUNT_PER_MIN;
2019-02-01 02:56:00 | dlq_file_sink_06__01 | 9
2019-02-01 03:10:00 | dlq_file_sink_06__01 | 8
2019-02-01 03:12:00 | dlq_file_sink_06__01 | 5
2019-02-01 02:56:00 | dlq_file_sink_06__02 | 5
2019-02-01 03:12:00 | dlq_file_sink_06__02 | 5
Since this table is just a Kafka topic underneath, it can be routed to whatever monitoring dashboard you’d like. It can also be used to drive alerts. Let’s imagine that a few bad records are expected but that any more than five in a minute is a sign of bigger trouble:
CREATE TABLE DLQ_BREACH AS \
    SELECT START_TS, SINK_NAME, DLQ_MESSAGE_COUNT \
      FROM DLQ_MESSAGE_COUNT_PER_MIN \
     WHERE DLQ_MESSAGE_COUNT>5;
Now we have another topic (DLQ_BREACH) that an alerting service can subscribe to, and when any message is received on it, appropriate action (for example, a paging notification) can be triggered.
ksql> SELECT START_TS, SINK_NAME, DLQ_MESSAGE_COUNT FROM DLQ_BREACH;
2019-02-01 02:56:00 | dlq_file_sink_06__01 | 9
2019-02-01 03:10:00 | dlq_file_sink_06__01 | 8
Where is error handling NOT provided by Kafka Connect?
Kafka Connect will handle errors in connectors as shown in this table:
| Connector lifecycle stage | Description | Handled? |
| start | When a connector first starts, it will perform the required initialization such as connecting to the datastore | No |
| poll (for source connector) | Read records from the source datastore | No |
| convert | Read/write data from/to the Kafka topic and [de]serialize the JSON/Avro, etc. | Yes |
| transform | Apply any configured Single Message Transform | Yes |
| put (for sink connector) | Write the records to the target datastore | No |
Note that there is no dead letter queue for source connectors.
To understand more about the internal operations of Kafka Connect, see the documentation.
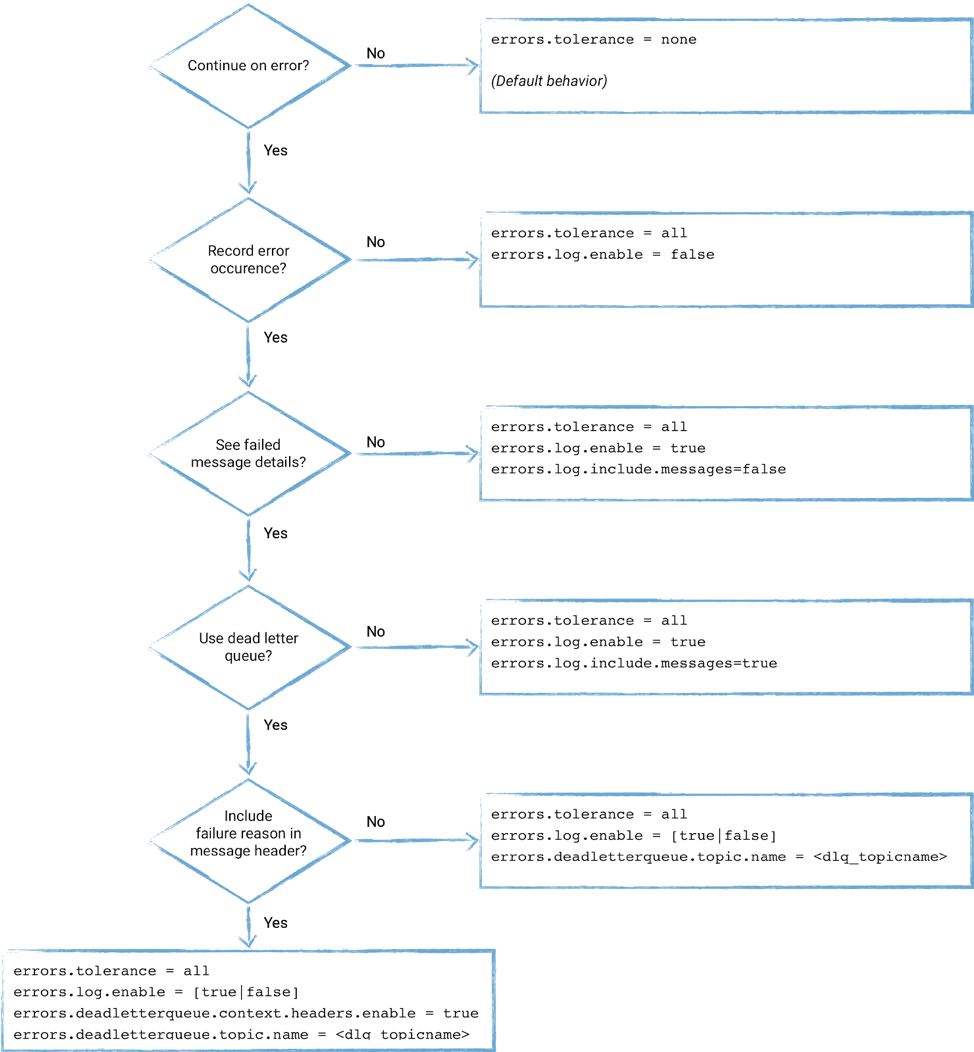
I’m confused!
There are a few permutations of how error handling in Kafka Connect can be configured. This flowchart shows how to choose which one to use:
Conclusion
Handling errors is an important part of any stable and reliable data pipeline. Depending on how the data is being used, you will want to take one of two options. If the pipeline is such that any erroneous messages are unexpected and indicate a serious problem upstream then failing immediately (which is the behavior of Kafka Connect by default) makes sense.
On the other hand, if you are perhaps streaming data to storage for analysis or low-criticality processing, then so long as errors are not propagated it is more important to keep the pipeline running. From here, you can customize how errors are dealt with, but my starting point would always be the use of a dead letter queue and close monitoring of the available JMX metrics from Kafka Connect.
If you’re looking to get started with Kafka, the fastest way is to use Confluent Cloud. You’ll receive $400 of free usage during your first 60 days, and you can use the promo code 60DEVADV to receive an additional $60 of free usage.*
Get started with Confluent, for free
Watch demo: Kafka streaming in 10 minutes
Ist dieser Blog-Beitrag interessant? Jetzt teilen
Confluent-Blog abonnieren


Kafka-docker-composer: A Simple Tool to Create a docker-compose.yml File for Failover Testing
The Kafka-Docker-composer is a simple tool to create a docker-compose.yml file for failover testing, to understand cluster settings like Kraft, and for the development of applications and connectors.


How to Process GitHub Data with Kafka Streams
Learn how to track events in a large codebase, GitHub in this example, using Apache Kafka and Kafka Streams.